Your program is now downloading
This may take a few seconds!
Related PowerPoint Templates
Free download
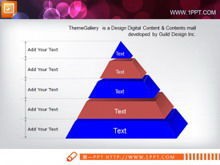
Circular association growth promotion ppt template icon
Circular association growth promotion ppt template icon
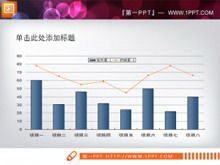
Commonly used PPT histogram line chart material
Commonly used PPT histogram line chart material
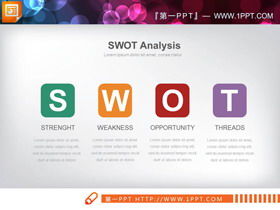
Swot analysis PPT chart of rounded rectangle design
Swot analysis PPT chart of rounded rectangle design
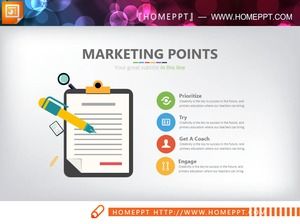
Color micro three-dimensional diffusion relationship PPT chart
This is a PPT chart of the color micro stereoscopic diffusion relati...